- NewForm AI
- Posts
- How many ad variations should you make?
How many ad variations should you make?
Concepts vs. variations, a mathematical deep dive with empirical data
Hamza Alsamraee
January 26, 2026

Part of a series on making sense of paid ads from first principles.
How many ads should you make per concept?
We get this question all the time. And I think it is the most misunderstood topic in all of performance marketing today.
You have two camps: those who preach very low asset counts per concept (as low as 1-2), and those who preach many, many variations. I think neither did the math. So it's time to actually settle the question. What amount of variations is ideal, mathematically?
The meta behind Meta
It may help to establish exactly how Meta's algorithm works first.
Meta’s delivery system is basically two systems stitched together:
A real-time auction that decides whether you win an impression over other advertisers
A prediction + exploration engine that decides which people to show your ad to
The recent development in the latter is what people hype up as "Andromeda," but this engine has existed for a while. It just got way better with Andromeda, which Meta describes as “a personalized ads retrieval engine designed to match ads to people at scale, enabling significantly more personalization in the ads delivery process.”
Let's focus on the latter, for auction dynamics are beyond the scope of this article. Every time an impression is available, Meta evaluates a set of candidate ads and computes something that resembles a total value score to pick which to show. It has a few main variables:

Penalty here can be thought of as how engaging (or not) an ad is. From Meta's own words,
“Each time there’s an opportunity to show an ad to someone, an ad auction takes place to determine which ad to show.” ...“Since we want each person to see relevant ads, the ad auction considers predictions of each ad’s relevance for the particular person. This means that ads with higher relevance can win ad auctions at lower costs.” ... “Relevance predictions estimate how likely the person is to consider the ad high quality and take the advertiser’s desired action.”
If an ad is likely to cause users to churn off the platform, Meta would rather not show this ad, and your bid has to be much higher for this ad to be shown. This is why advertisers with bad creatives see higher CPMs on average.
So just make the best hooks! Just maximize engagement, right? That’s the wrong approach. Creative is often thought of compositionally—as a sum of individual parts. It's not. We went over this in an earlier article. Meta doesn’t reward each part of the creative directly (this is essentially why the best organic videos fail as ads, btw, but that’s a topic for another day).
A creative is translated into a mapping that then passes through downstream models that determine where, in the user and context space, it is served. To hear it from Meta directly,
The user models process a vast amount of user-side signal (features) to synthesize compact user embeddings (representations). These embeddings are then seamlessly integrated into various downstream production models.
Essentially,
Meta's system needs to show an ad
It guesses where total value is highest based on both upstream (user-level) models and downstream (campaign objective specific) models
See appendix for further details
It allocates impressions to users and contexts where the expected value of a conversion looks high
It updates its guess with more data
Meta is balancing an explore-exploit problem. It needs to continually exploit audiences where this probability of conversion is high (what keeps your CPAs good) while exploring new demographics/placements/contexts (at scale this is hard which is why incrementality is a whole thing).
At low spend, the explore budget is a significant fraction of your total. That means your results are sensitive to what you happened to explore first. The first few hundred impressions can lead Meta down completely different paths. To this effect, small changes can shift the ad’s learned representation to a new embedding neighborhood and significantly alter the audience it targets (and therefore its downstream CPA).
A lot of Meta research is centered around this problem, namely this article on deep exploration. From the article, “A major challenge to existing RS algorithms arises when positive feedback is rare and tends to arise only after a series of suitable recommendations...Exploration is vital to sample efficiency when faced with sparse and delayed user feedback.”
More budget helps this problem, but it doesn't fix it. Hypothetically, performance converges to a "true CPA" for each creative after enough exploration, conditional on budget. But slight tweaks in creative can trigger significantly different mappings in Meta's backend.
Meta's algorithm is inherently stochastic and not deterministic at low scale. At testing levels of spend, the same ad can be a winner one day and a loser another because it gets embedded in a different representation space. We've seen this happen at least twice. From the SUM paper cited above, “even for the same inference input, the computed user embeddings are changing over time. We call this phenomenon ‘embedding distribution shift’.”

From the SUM paper: user representations are inherently unstable; one of the primary purposes of SUM is to stabilize these embeddings.
Understanding how Meta’s system works allows us to now think about why variations are worth making in the first place.
Why make variations under Andromeda?
Many "gurus" will tell you Andromeda this, Andromeda that, variations don't matter! Meta will cluster them as the same ad!! This is:
objectively not true (anyone who has done any creative testing ever knows that variations have different performance)
misses the point.
The point of variations is not to scale multiple variations at once. The goal behind variations is two-fold:
To rule out false negatives. Once you try a concept, you don't want to keep trying it if it's clearly a loser. As seen above, Meta’s stochastic nature means missing winning concepts is inevitable
To find the most efficient variation of said concept
Both of these objectives have a clear mathematical formulation that enables us to compute an ideal number of variations.
For this research, we looked at thousands of ads that have been run through our creative operating system, Framework. Framework plugs into the Meta API directly and automatically launches creative tests, allowing us to test thousands of ads more efficiently than Meta would on its own. It automatically turns off losers, moves winners to scale campaigns, and generates creative analytics reports at the end of the testing window.
Through Framework, we are also able to understand the "meta" behind Meta. With clean data, we are able to get an accurate picture of what it means to run a truly optimized creative supply chain.
First, a bit about our dataset that we used here:
2360 ads with significant spend over the last 3 months
365 concepts with significant data
N=31 clients
Data from late Q3 through Q4
How are winners distributed across concepts?
The average concept is not good. The good ones usually have more than one winner.

With framework, each concept is pushed out as its own batch. That allows us to see very quickly what concepts are promising and which need to be killed. 2
The average number of winners per winning concept is 2.16. The goal of any successful creative program is then to find as many of these winning concepts as possible.
How many variations to properly test a concept?
If you test one ad, is that a good enough test of a concept? What about 3? What about 10? 100? To answer this, we need to think about the variance of ads within concepts. To give you a sense, the difference between the best and worst performing ad within a concept is 4.55x on average. More than four times! If we normalize it to the KPI, the number is 1.96x KPI. So if you have a KPI target of $50, your best variation may be at $40 but your worst is at $138. That is a huge difference.
That means even within winning concepts, not all ads will be winners. It turns out that within winning concepts, roughly 25% of ads are winners.
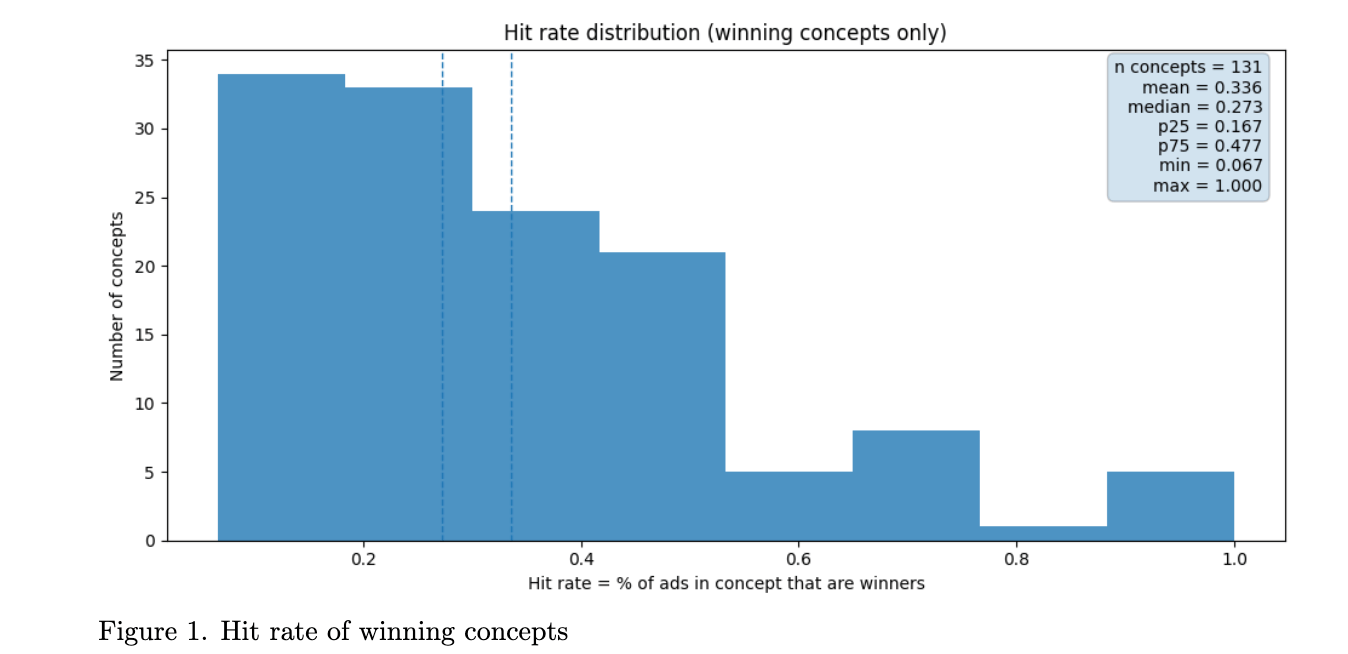
Based on this, we have a clean mathematical formulation for avoiding false negatives. To illustrate the math, assume that all winning concepts have a 25% hit rate. So if we test one ad, there is a 75% chance we don't find a winning ad and we rule out this concept as a loser. Very bad math for the unique ad folks. Well, what about two? Then it's:

Still terrible odds
If n is the number of variations, then

I don't know about you, but I like catching most winning concepts. Assume you want to catch 90% of winning concepts. Then

But this assumes that the hit rate is .25 across all batches which is obviously not true. We can get a more representative number by summing over all batches and their hit rates over our dataset.

Where hi is the ith batch hit rate and n is the number of variations we are trying to solve for. If you want to catch 80% of winning concepts, the math gives you n=6-7. To catch 90% of winning concepts you need 11 variations. For 95% you need 16. This is why we make variations. I looked at our data, we make ~ 9.7 ads/concept on avg. We're catching 89% of winning concepts based on the formulation above.
This is assuming you have a good creative team that makes variations distinct enough such that we can consider their results statistically independent-ish (less diverse variations mean you need to make more variations btw, not less). If variations are correlated, the true required n is higher. An interesting future essay would be looking at just how independent variations are within a concept.
Finding the most efficient variation
Another reason to make variations is that rarely will the one variation you make be the most efficient one. We saw above how much variance there is within concepts. Some of that is statistical noise, but there is true variation in expected CPAs even with small changes.
At the highest of scales, you need not just ads that win, but ads that win big. We looked at winners by client and tried to understand: what does it take to make a mega winner? A winner that is top quartile relative to the account?
Inevitably, more variations are needed to unlock top-quartile winners with high confidence.

But this doesn't change the math too much actually. One must ask, when does the incremental variation stop making sense? First, we must look at the marginal probability of getting such a winner within a winning concept. This can be written as

Where n is the number of variations and pw is the probability of getting a winner in a winning concept (ie a concept with at least one winner). We must solve for when

Where pglobal is the global probability (across all ads) of hitting such a winner (across our data set this is 3.93%)3. Solving the inequality gives a cutoff around 9, meaning 10 variations is ideal.

The larger your budgets are, the more likely the math is stacked towards more variations. As your budgets grow, your global hit rate becomes lower and the marginal probability of a variation in a winning ad is more attractive.
How many variations should YOU make?
In practicality, early accounts should focus on finding their bread and butter concepts as fast as possible. This means indexing for more concepts and fewer variations. This is why, for new clients, we run through ~10 concepts within the first 6 weeks. As you establish creative learnings, variations become more lucrative statistically.
At the end of the day, make ads you believe in. Don’t do variations for the sake of variations, but always introduce them because it can be incredibly counterintuitive which variations work. We actually made a quiz internally to see if we can predict winning variations within concepts. Ads are our day job, and it is still perplexing. I only got 2/3 right.

So definitely make variations. The magic number will vary by dataset and scale of ad account. But if there is one takeaway from this article: don’t make unique ads. The math overwhelmingly rules out this approach.
Appendix
Meta does not have one “model” or algorithm. Its ad system architecture consists of hundreds of models, each with specific goals. Personalizing each with the stringent constraints around latency, memory, etc of an ad network is impractical. So Meta operates in a dual structure with two general types of models:
Upstream user-level models
A few general large models that consume massive amounts of user-side signals like their click and behavioral history to produce dense user embeddings (skip to 5:55 in our talk at MGS 2024 for why this is useful)
Downstream ad ranking models
Task-specific models (CTR, MAI (mobile app install), CVR, etc)
There are hundreds of these, which take the user embeddings and ultimately serve the ads that maximize business outcomes
This architecture is described extensively in Meta’s SUM (Scaling User Modeling) paper.

From SUM paper
The goal of this architecture is to give these downstream task-specific models accurate, frequently updated user embeddings that they can then use to maximize conversions.
We wanted to understand if different downstream models necessitated more variations than others. The SUM paper actually provided NE (Net Entropy) and FI (feature importance) results across a few key downstream models, and the results are telling:

From the SUM paper. Notice how MAI CVR is the lowest NE diff and highest FI
NE can essentially be thought of how hard the signal is to predict. While CTR models benefited largely from these SUM user embeddings, MAI CVR does not as much. This makes sense: app install conversions are noisy (relying on app store pages, sparse in frequency) and often delayed (SKAN). At FI=24, SUM embeddings are still very important but the problem is inherently noisier.
Actions with sparser and more delayed feedback require more samples to overcome variance and avoid false negatives. Clearly, even large model architecture improvements do little to eliminate outcome variance. As a result, concepts optimized for MAI generally require more variations to be evaluated fairly than concepts optimized for denser signals like CTR, where confidence accumulates more quickly.
1 For ads with >3x KPI in spend but no events, we defined their CPA as their cumulative spend. Not all ads within a concept get significant spend
2 Fun fact: if the first four ads that pick up spend in a concept are losers, it is highly unlikely (4% in our data) that the rest of the batch has any winners. The global average for an ad to be a winner in testing is ~10% but the avg concept in our data set is ~10 variations. This means incremental variations past 4 failures have an individual hit rate of .8%, which is incredibly unlikely and just noise. So we now turn those concepts off to save our clients' budgets.
3 This is skewed a bit by early-stage accounts, larger accounts have a considerably smaller %. For large accounts, our analysis favors more variations.